JavaScript Rendering
for Data Visualization
Charts, Diagrams, and beyond — powered by one engine.
Powered by Flitter
Every chart is a widget tree. 10+ chart types, two visual styles, installed via CLI.


Used in Production — easyrd.dev
A database table editor used by 10,000+ users. Built with SvelteKit + Flitter + DBML.
Google's Creative Power,
Now on the Web
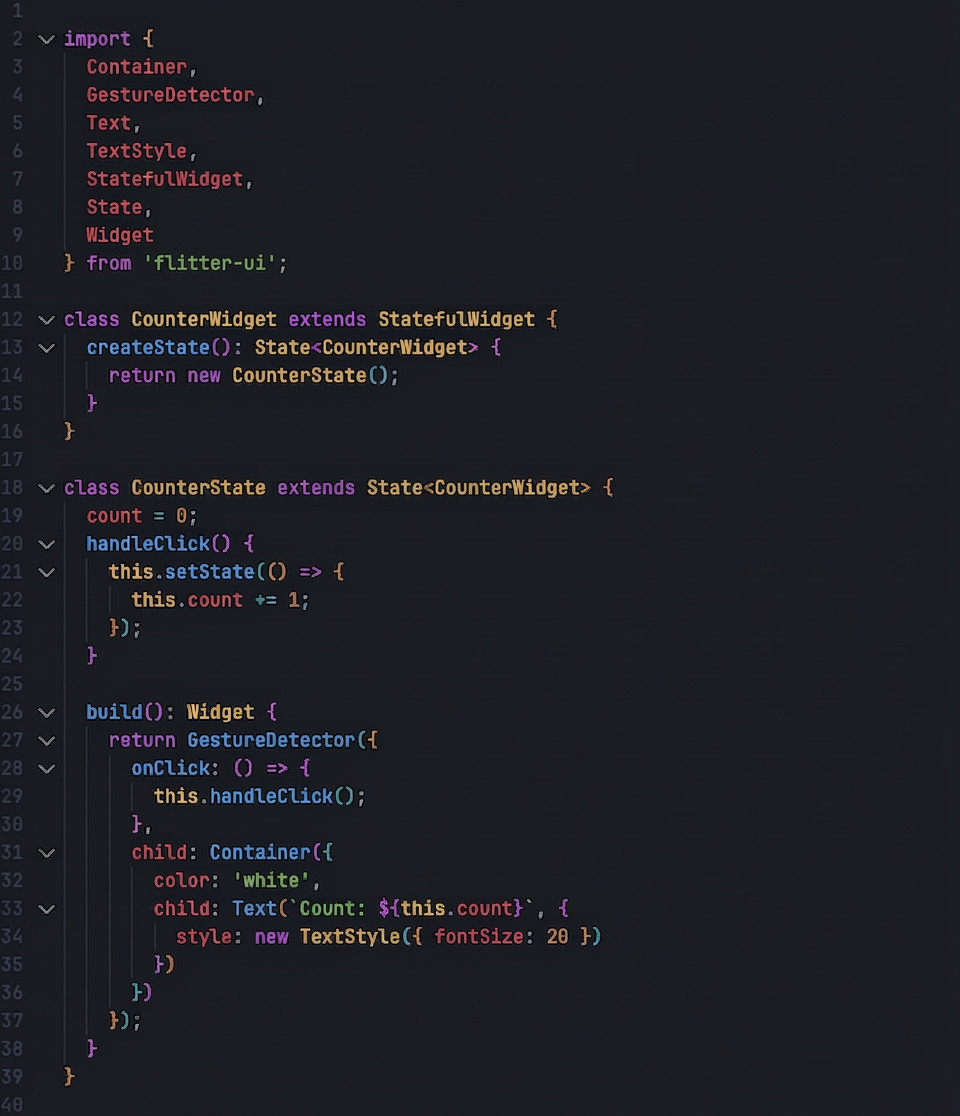
Flutter's declarative API, now in JavaScript. SVG & Canvas, one unified engine.
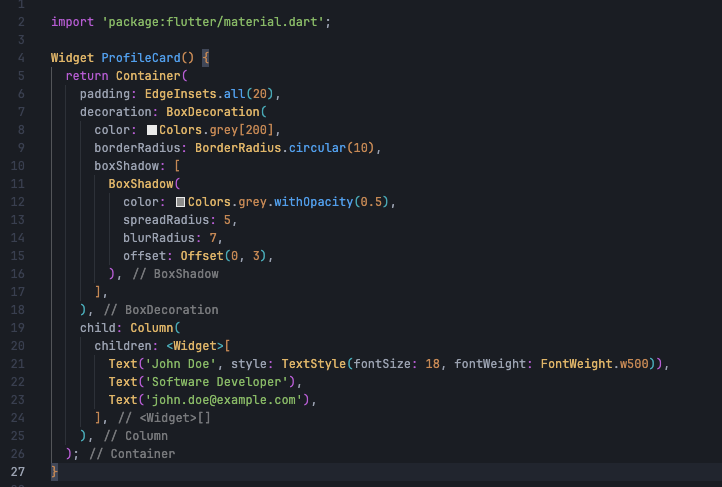
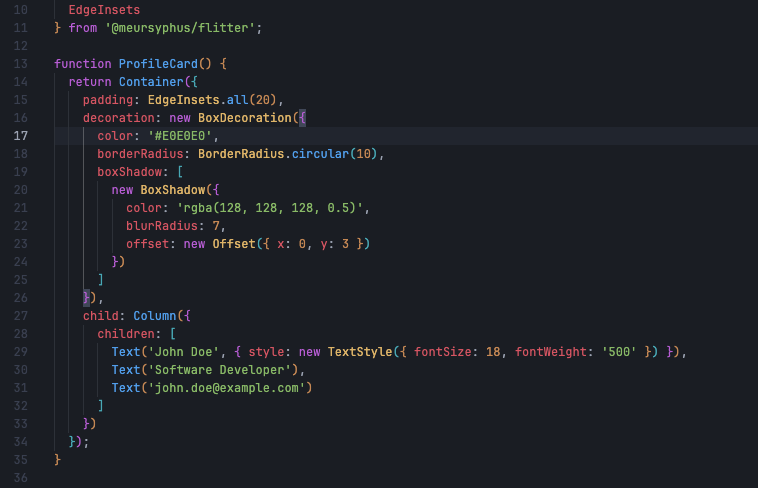
Declarative code that reads like a blueprint.
Box model layouts -- constraint-based, predictable, powerful.
SVG or Canvas? Both. One API, two renderers.
Interactive charts with click, hover, and gesture support.
Canvas events handled elegantly, no hacks required.
50+ widgets ready to compose into anything you imagine.
Rendering performance that scales with your ambition.

Daeseung Moon
Korean frontend developer, 7 years in.
I love building visual experiences on the web.
Also built by Daeseung
ssgoi — Page transition library for the web★800+
See What's Possible
Explore the chart gallery, dive into the docs, or contribute on GitHub.